Richmond Hill's Harding neighbourhood carries an average home listing price of $1,618,000 right now. Scroll the same page and the average condo in Harding lists for $606,000. Both numbers describe Harding. Neither number describes a house you can actually walk into and buy, because the "average" is doing what averages do when a small neighbourhood contains two structurally different housing markets: it draws a line straight through the empty space between them.
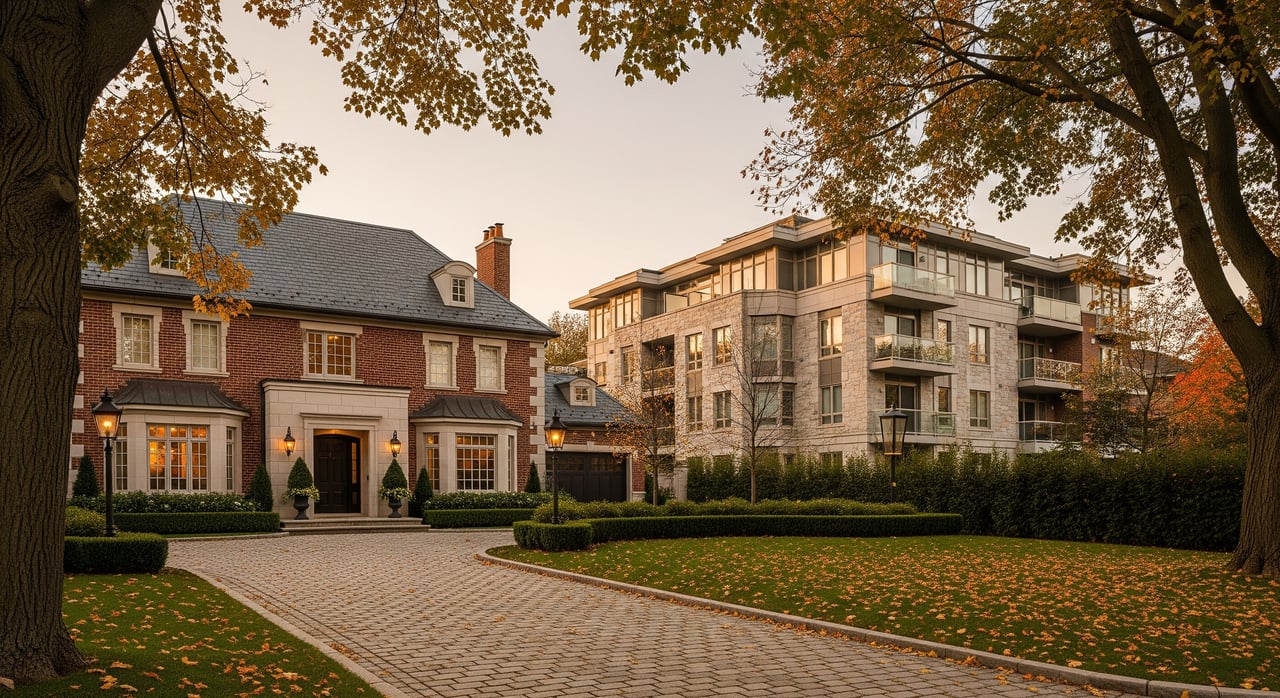
Harding sits inside boundaries that most buyers never think to check before they start comparing prices online: Yonge Street to the west, Bayview Avenue to the east, Major Mackenzie Drive to the north, Weldrick Road East to the south. Inside that box are 14-storey condo towers standing shoulder to shoulder with high-rise buildings along the Yonge corridor, and detached houses on quieter streets closer to Bayview. A buyer who takes the neighbourhood's blended average at face value is comparing themselves against a number that only exists on a spreadsheet.
Where The Split Actually Runs
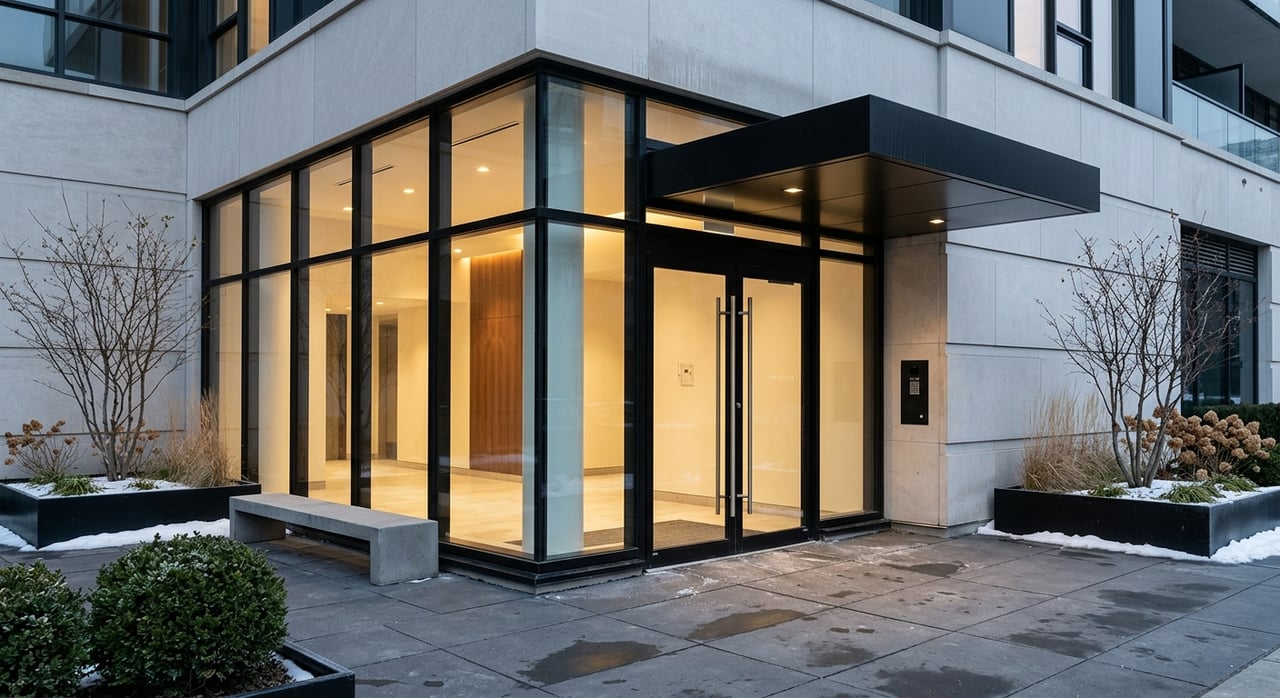
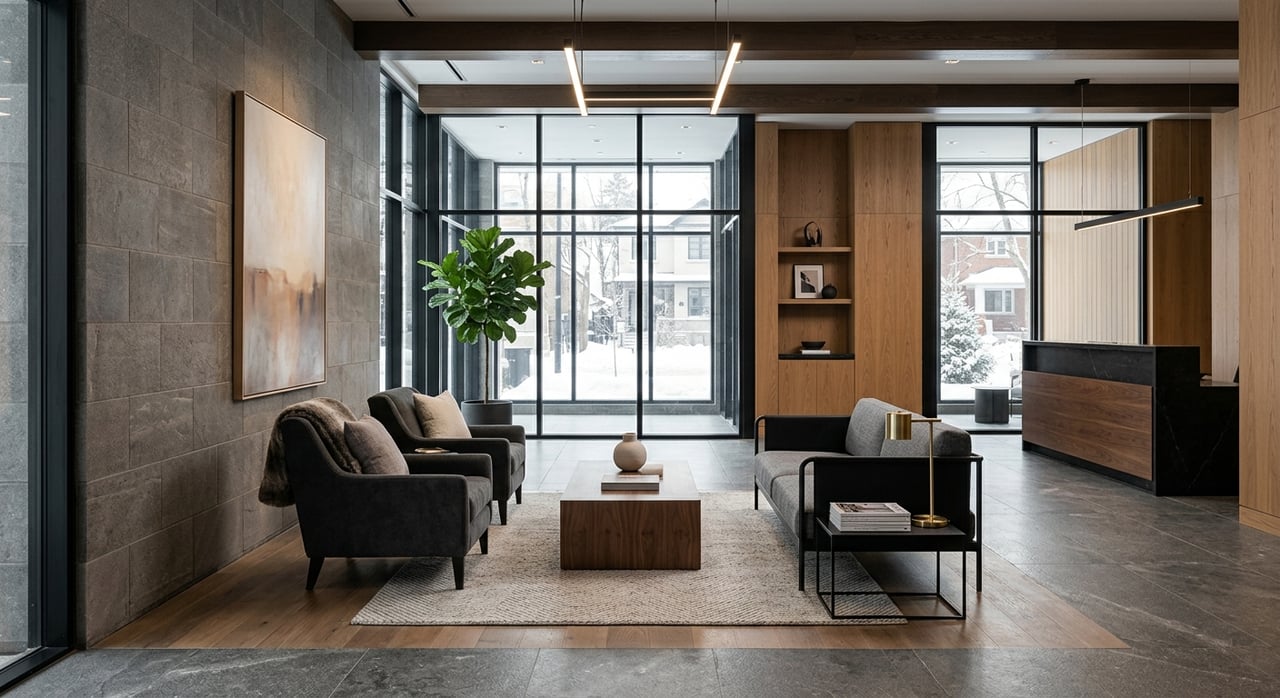
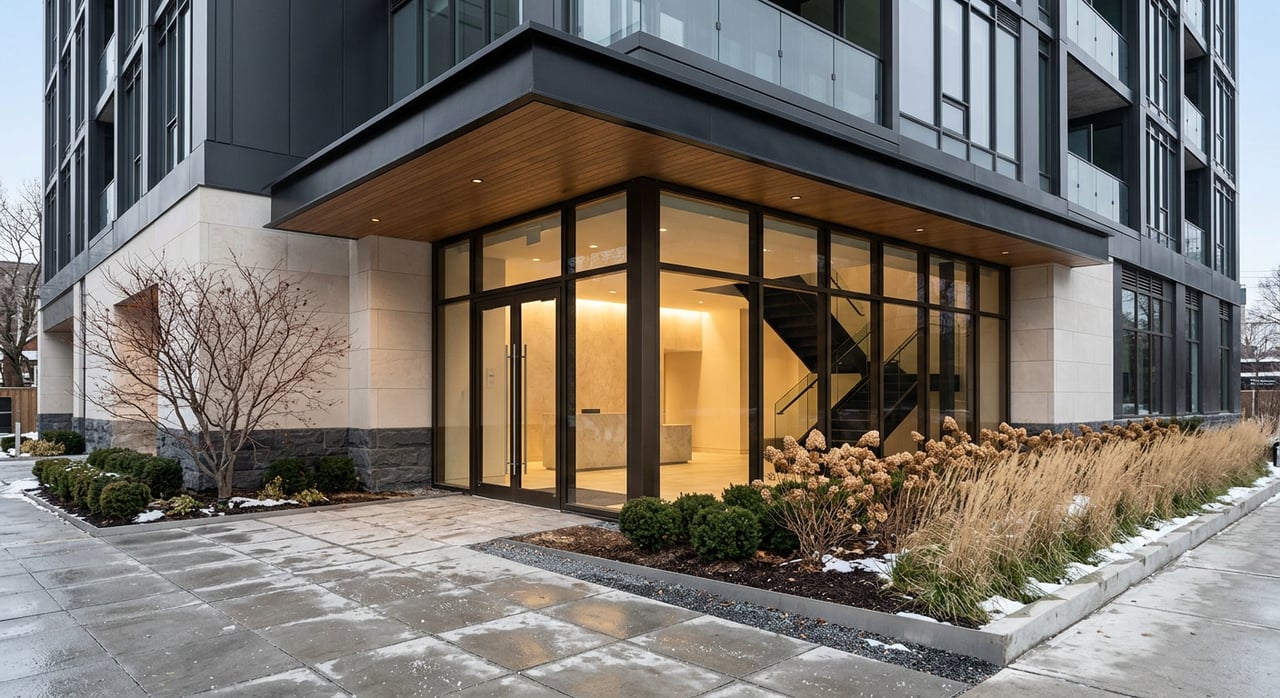
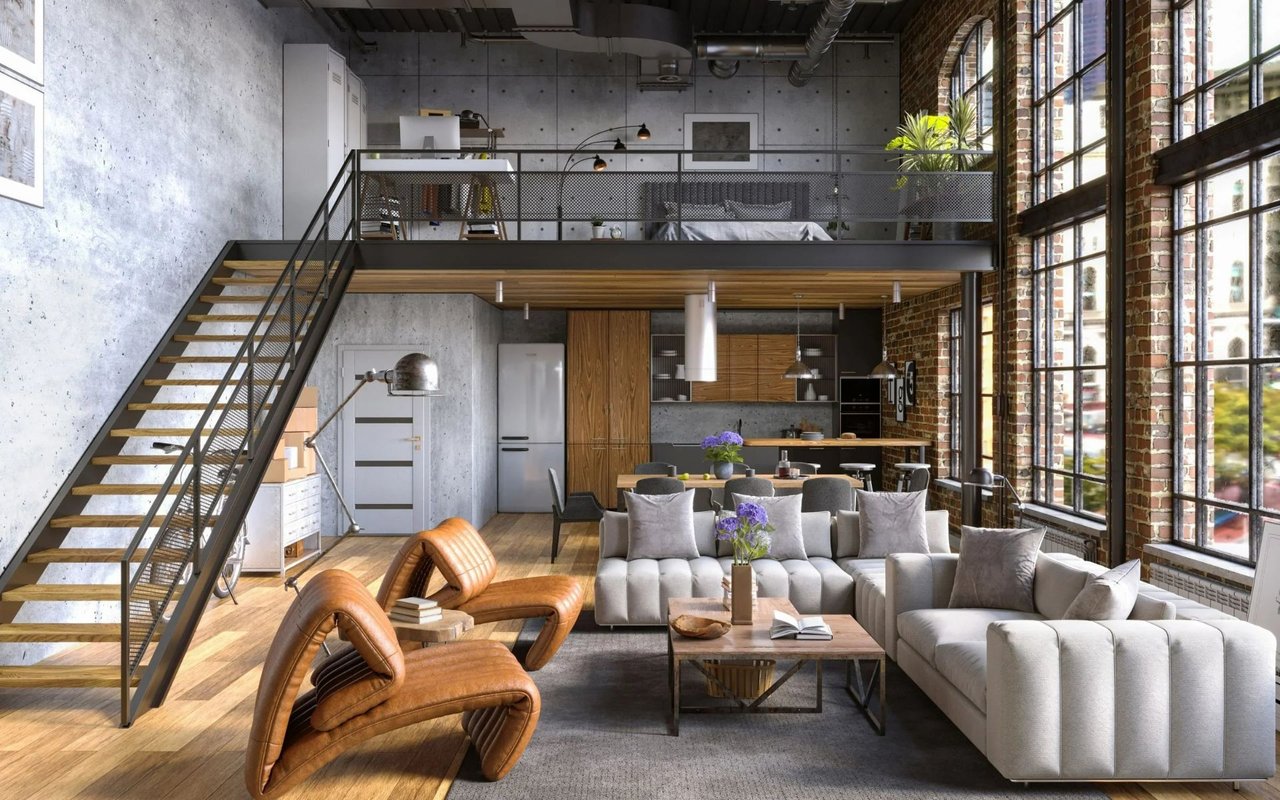
The Yonge Street side of Harding reads like a transit corridor because it is one. T&T Supermarket anchors the Weldrick and Yonge intersection, and the surrounding plazas carry the grocery stores, pharmacies, and restaurant strip that come with density. Walk a few minutes from a Harding Boulevard condo and you're passing Haze Restaurant + Lounge, Mr. Congee Chinese Cuisine, and a scatter of independent cafes before you reach Hillcrest Mall. This is the part of Harding where 18 storeys is normal and a parking spot is a line item on the closing statement.
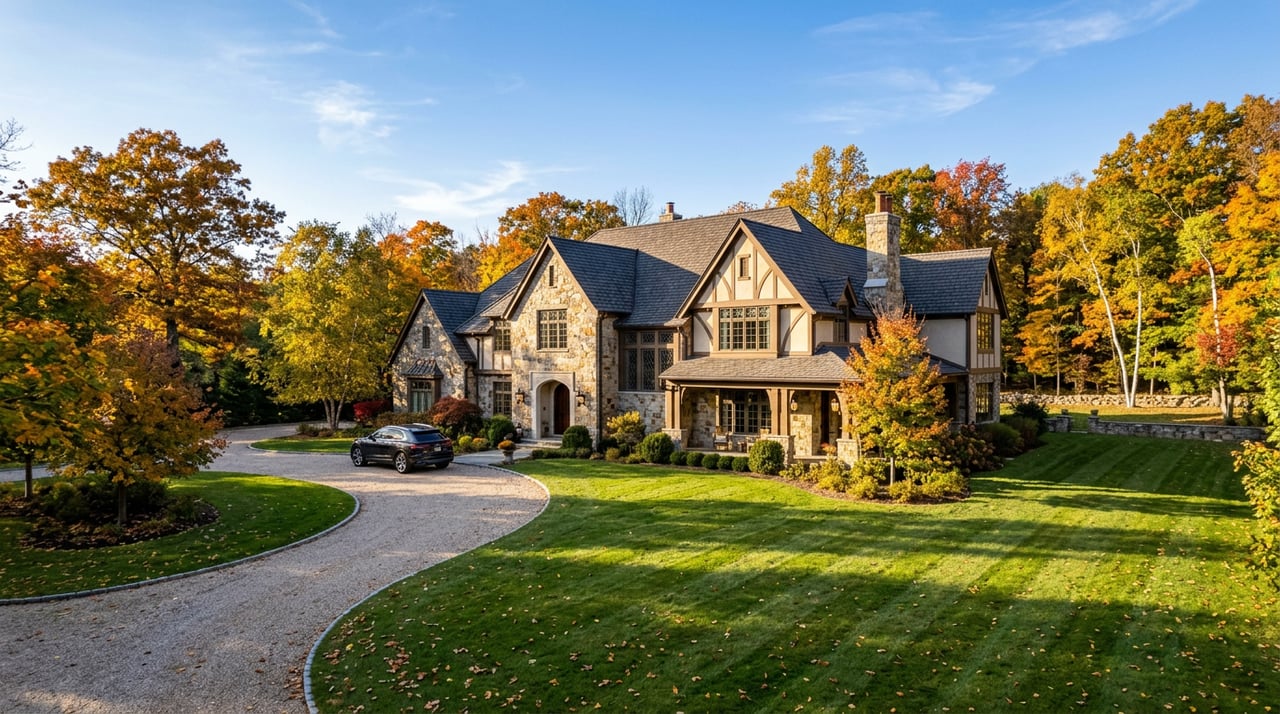
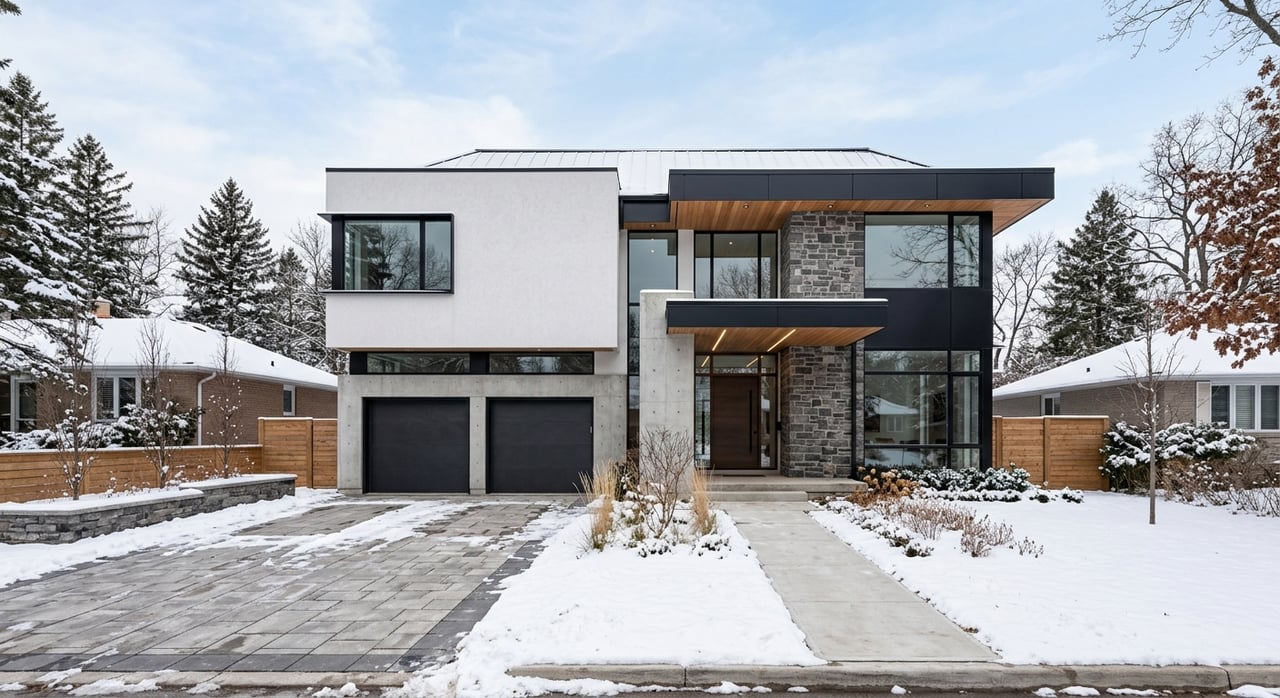
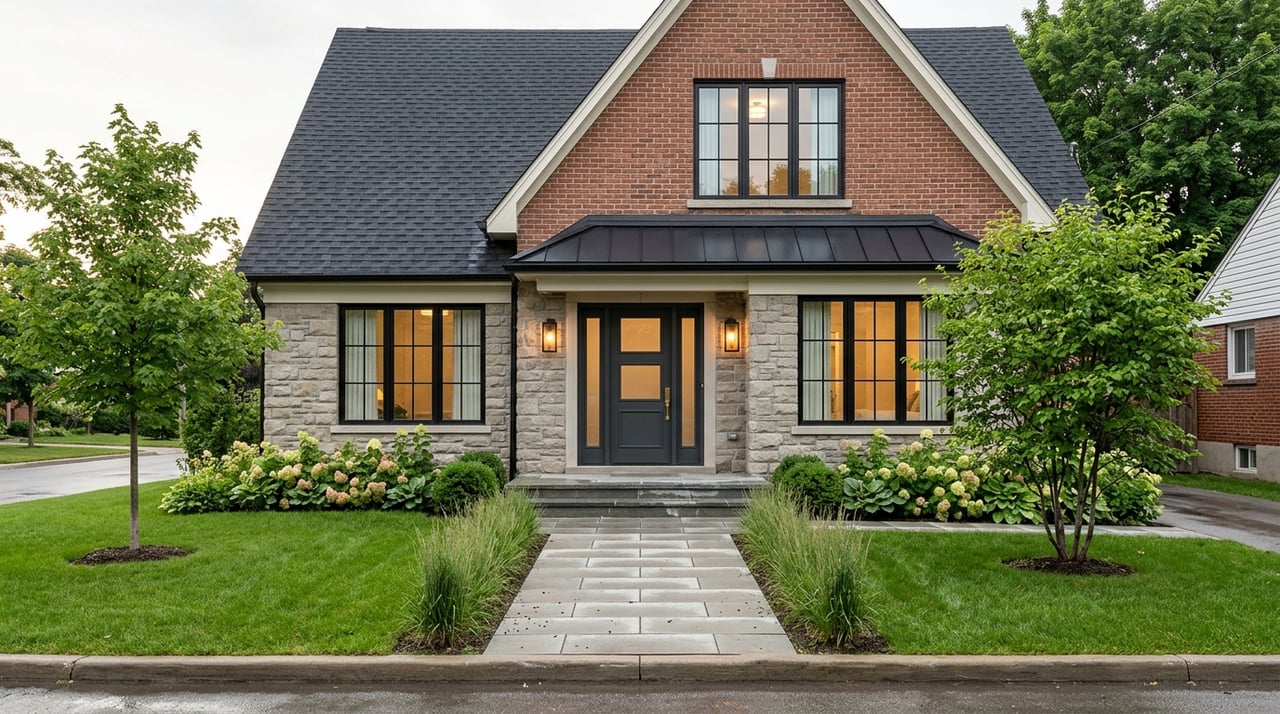
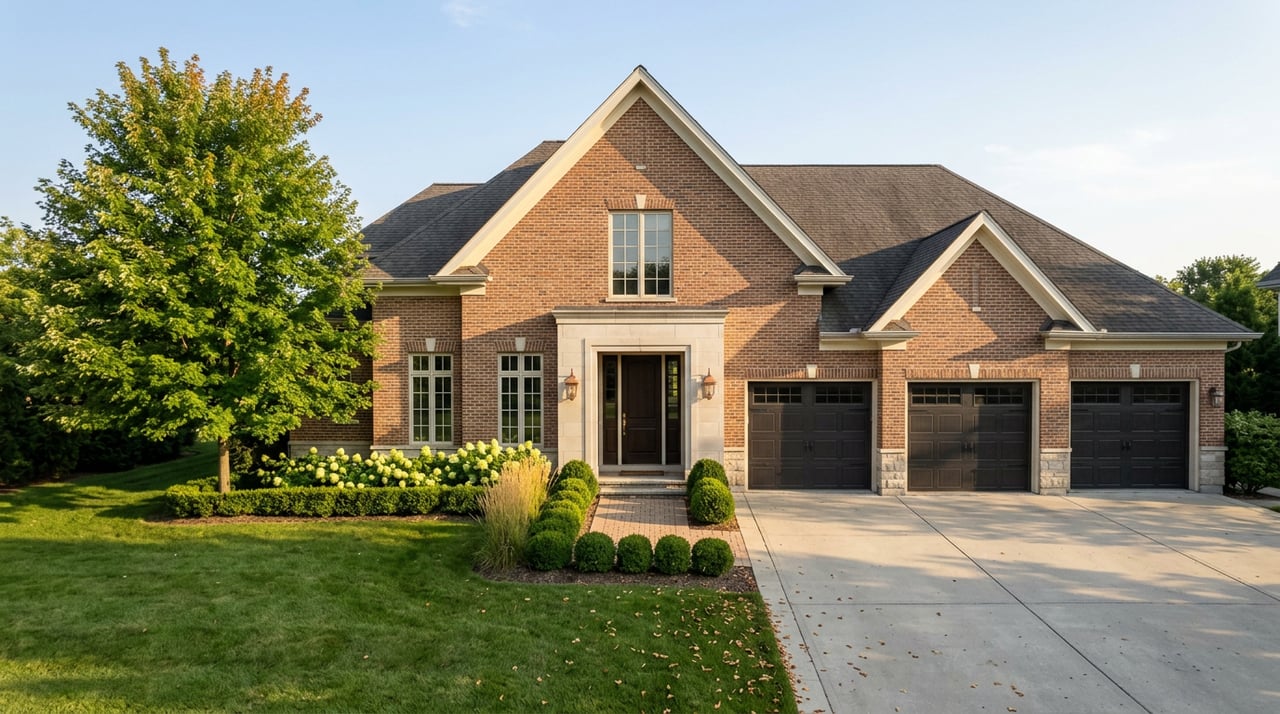
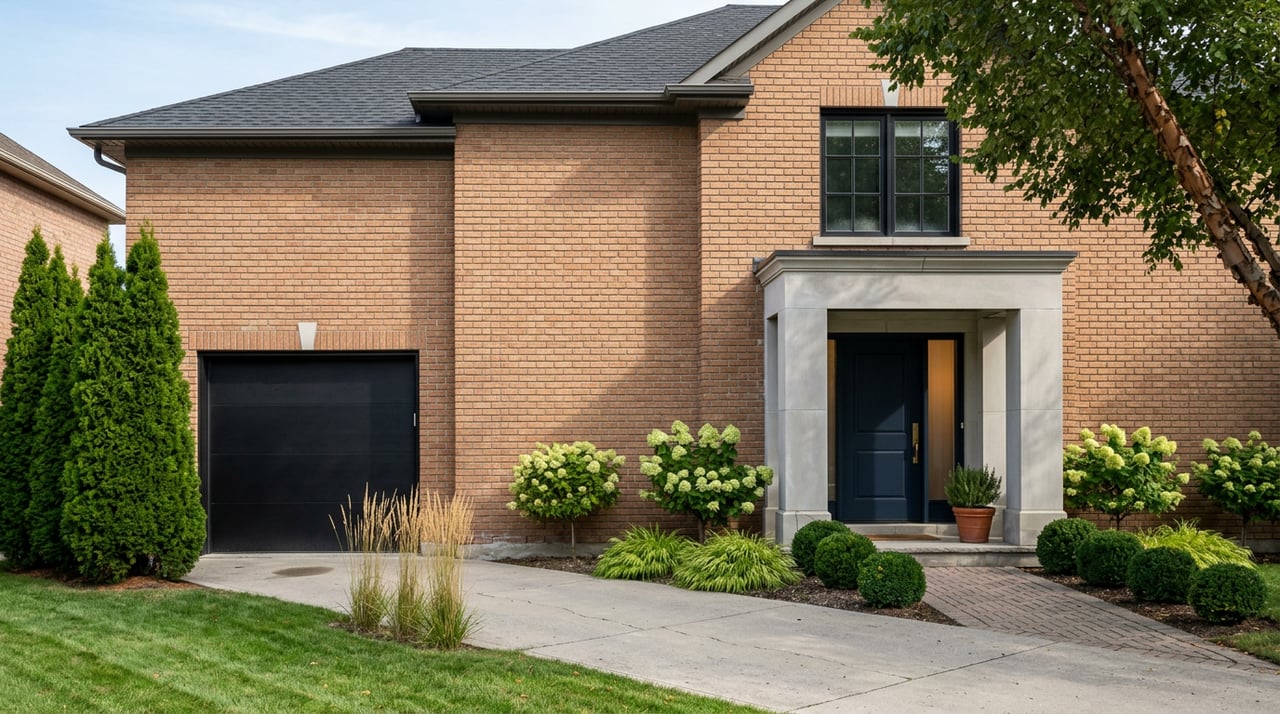
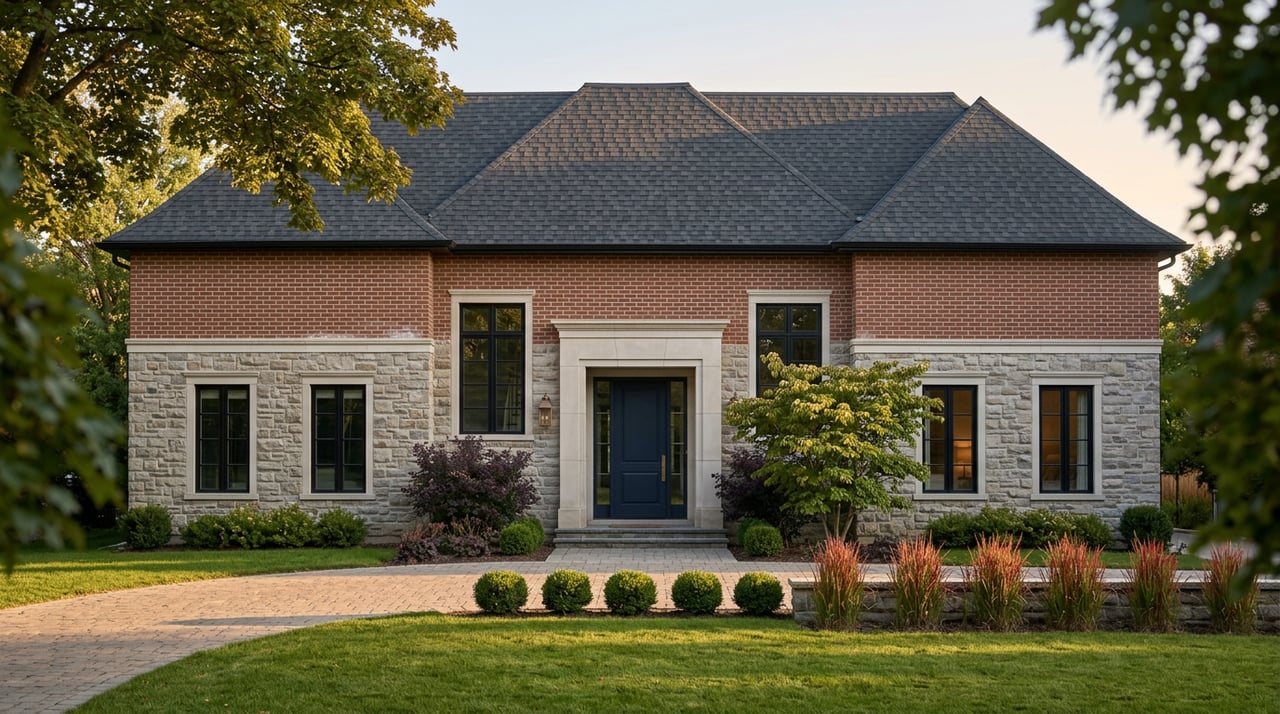
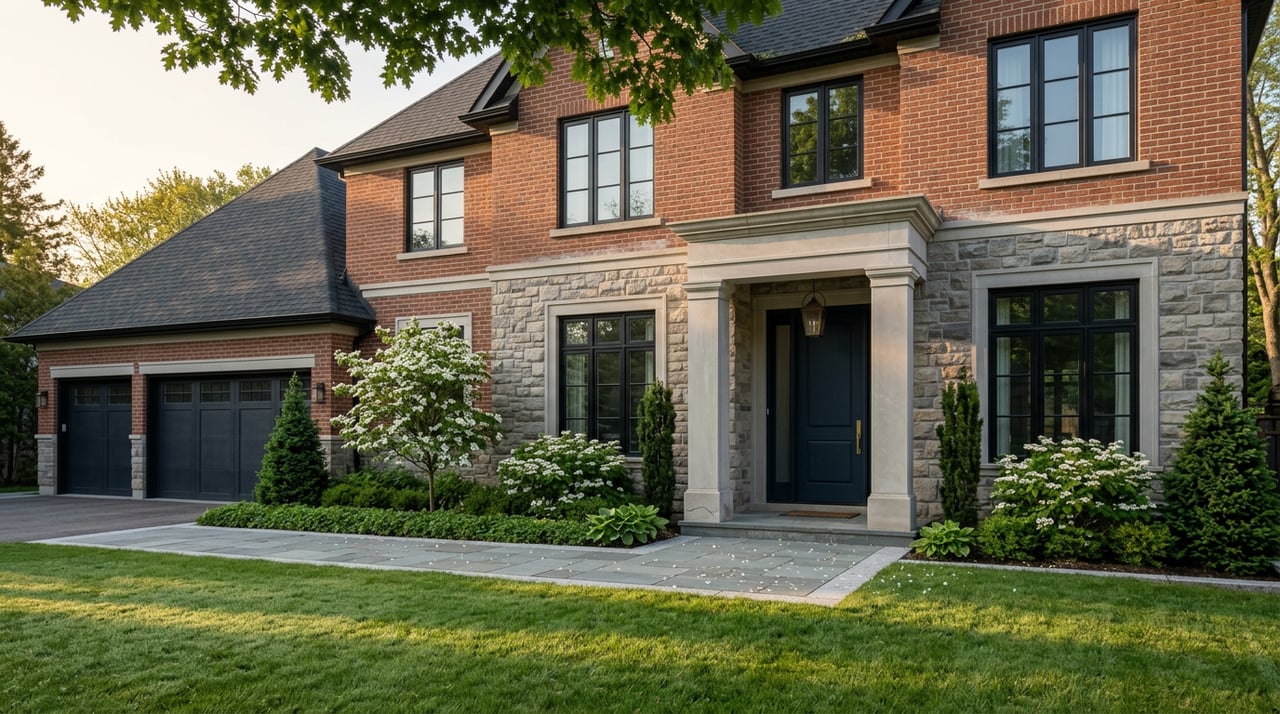
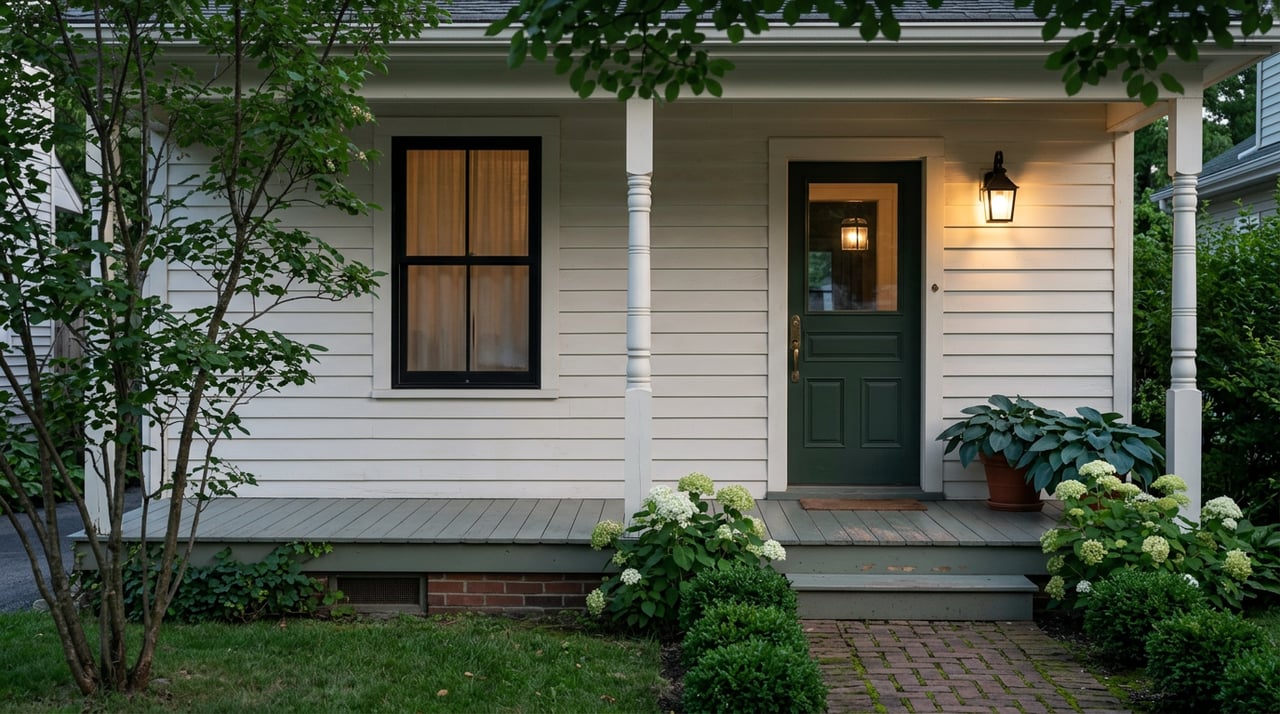
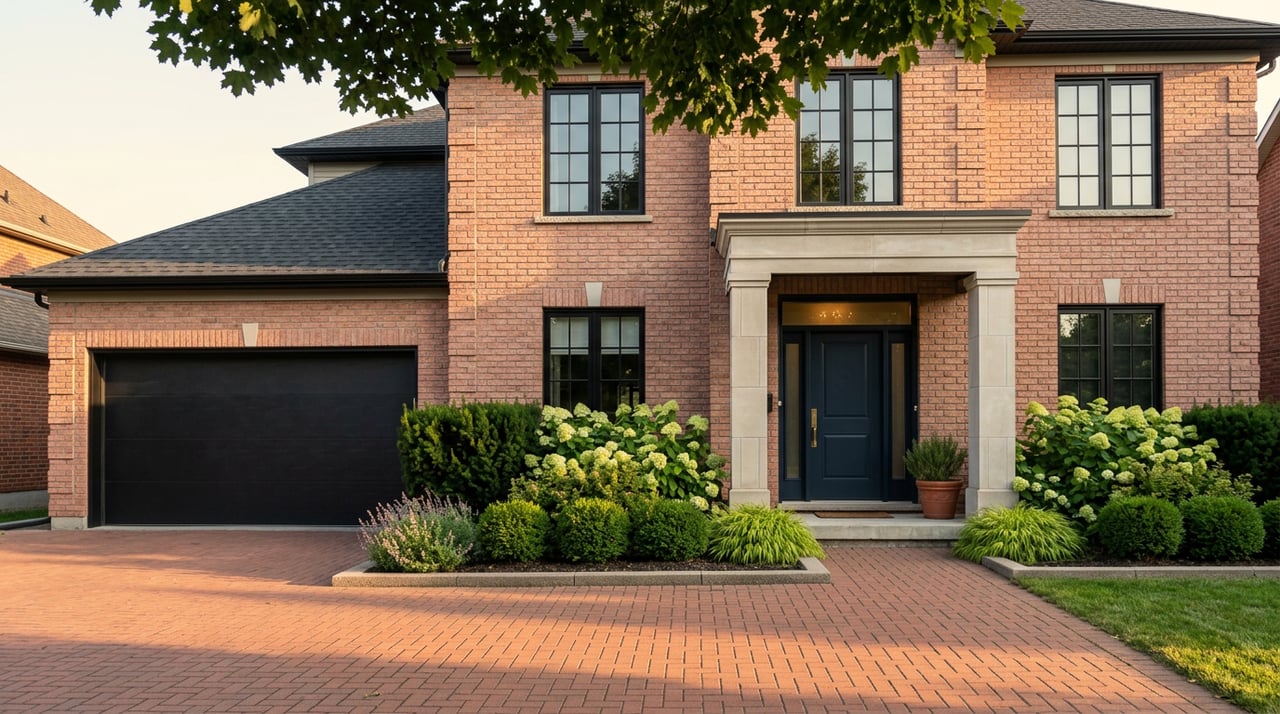
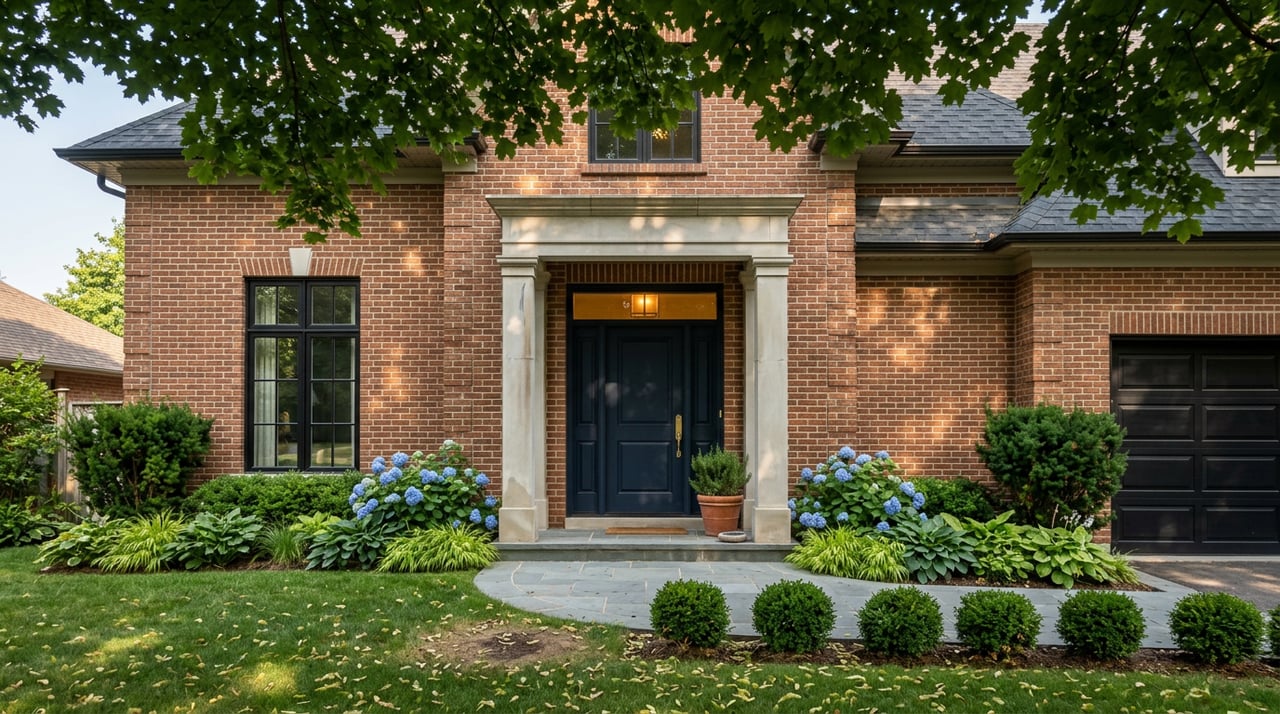
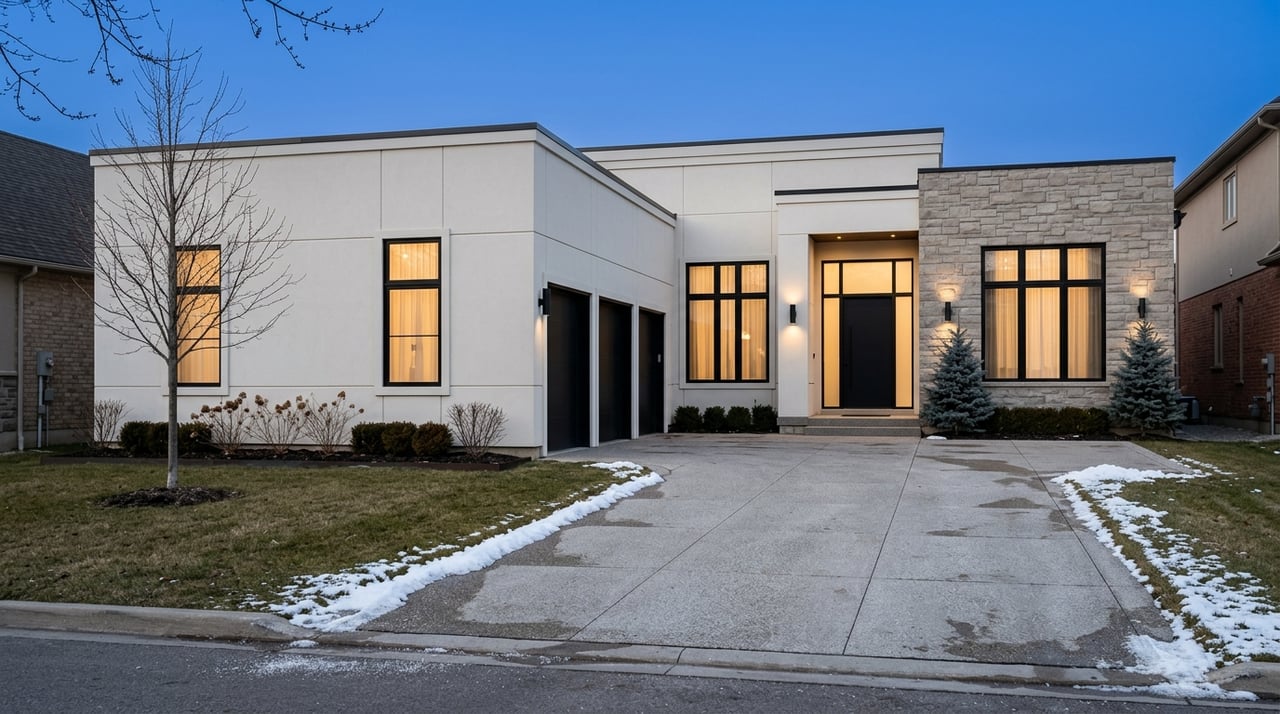
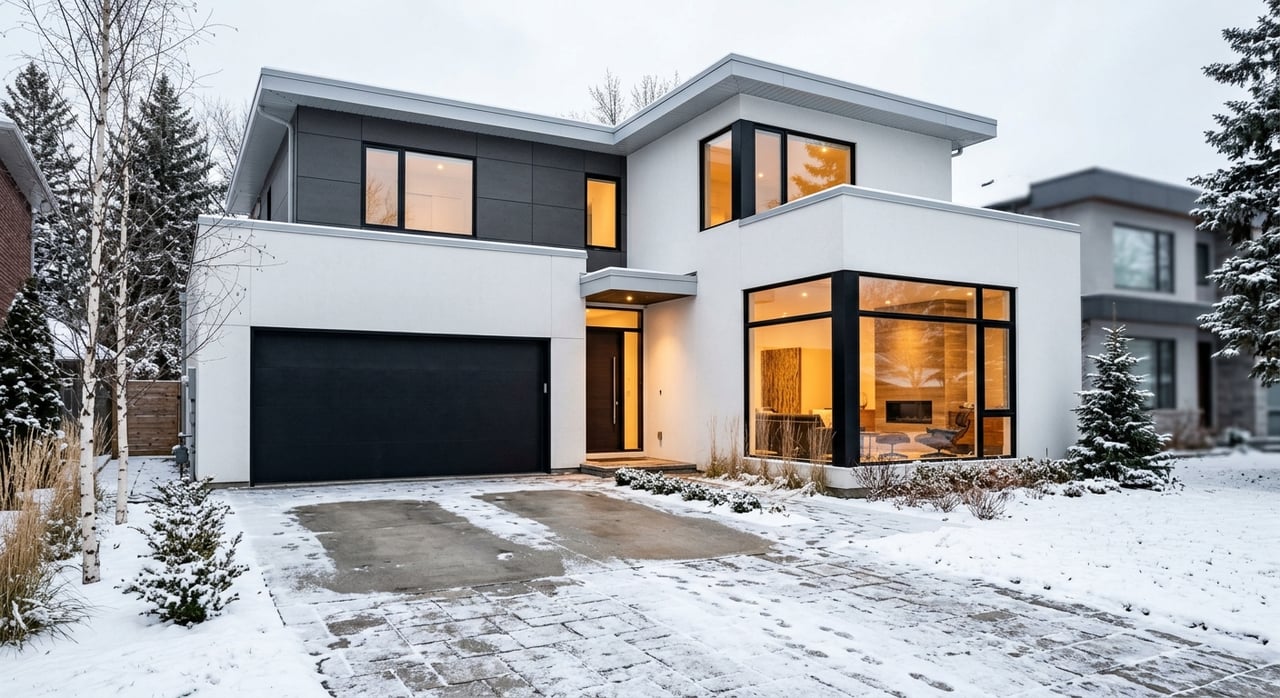
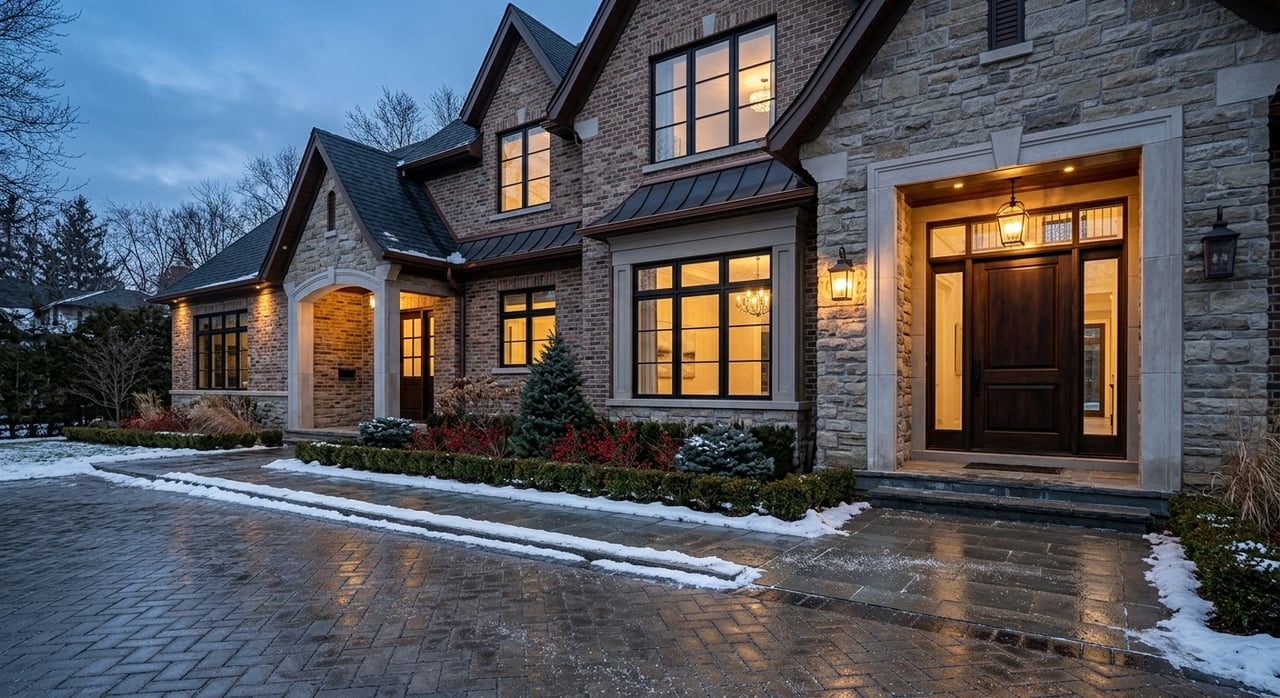
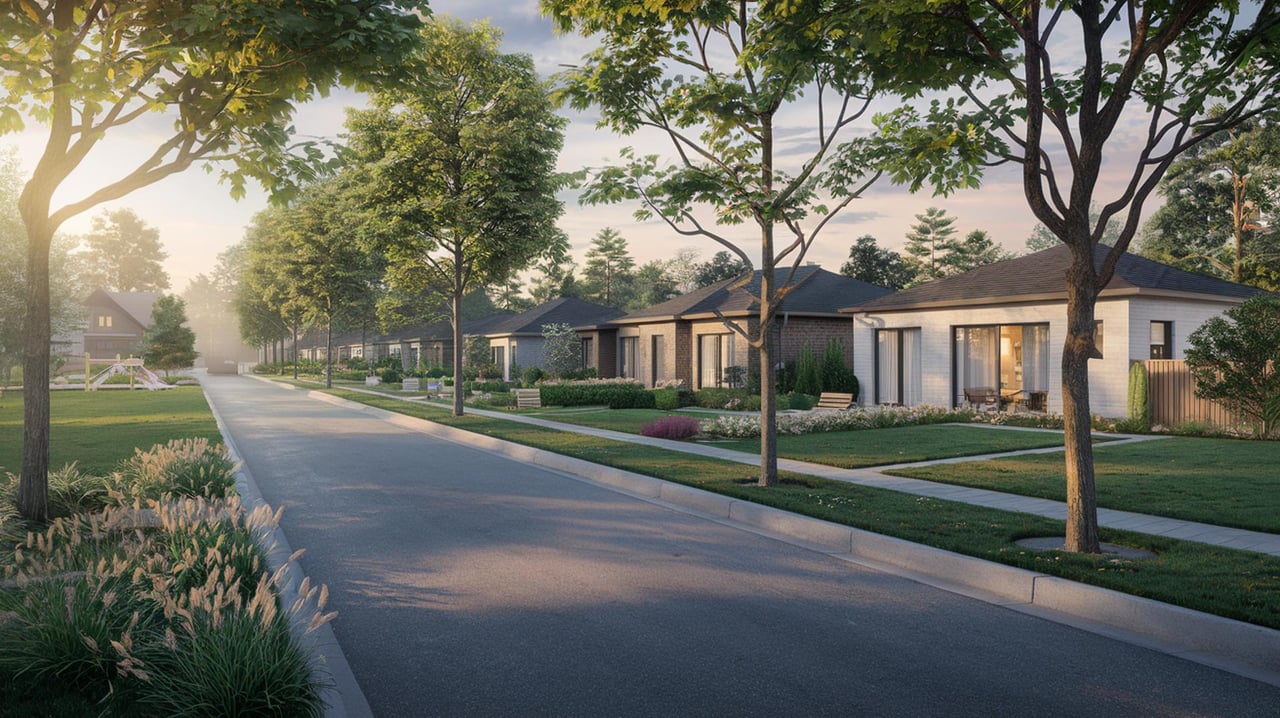
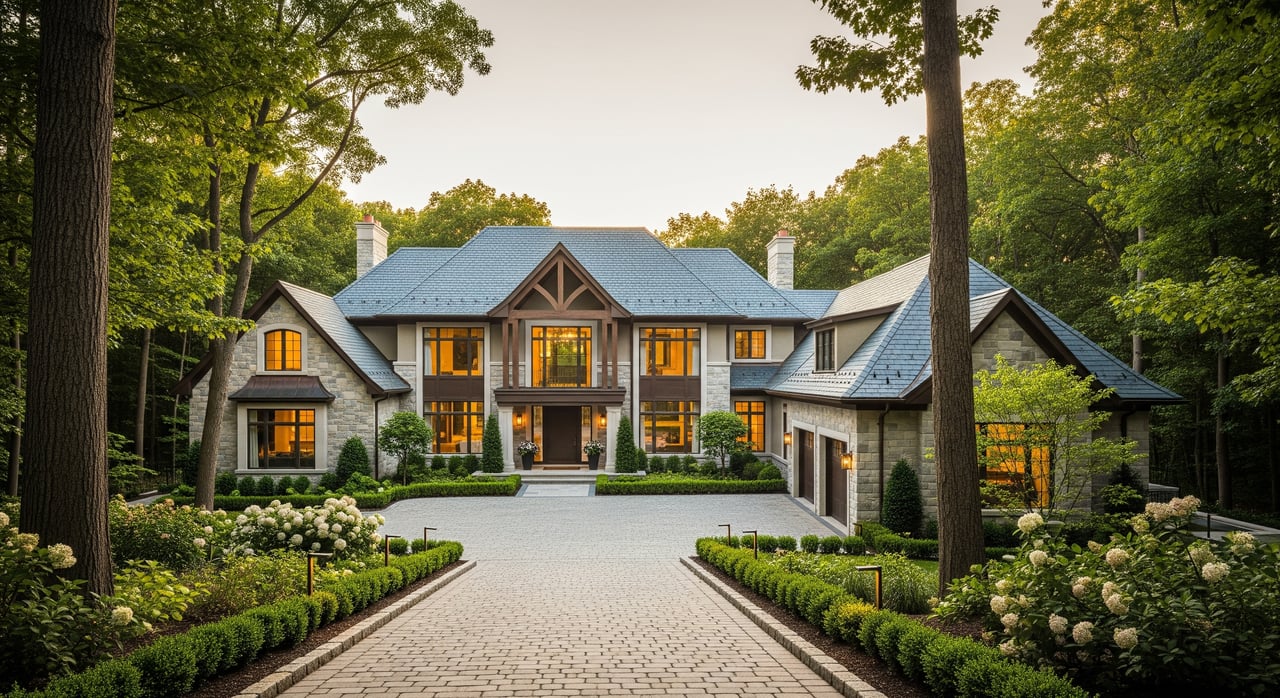
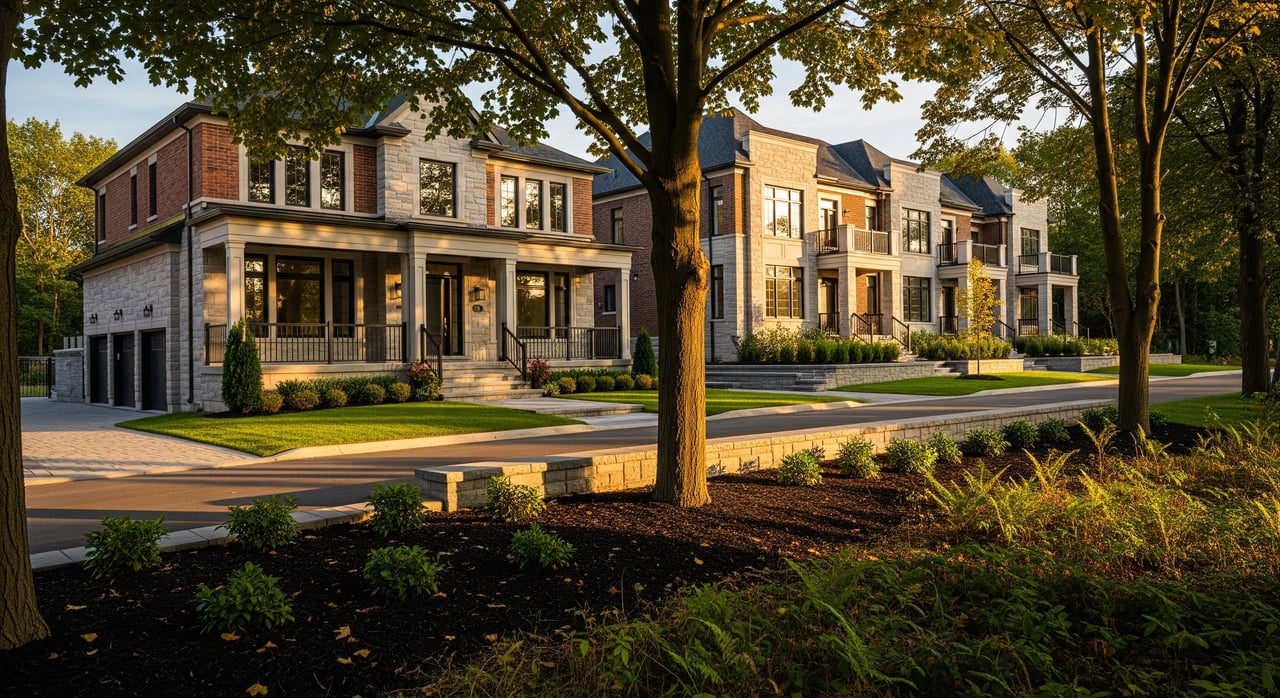
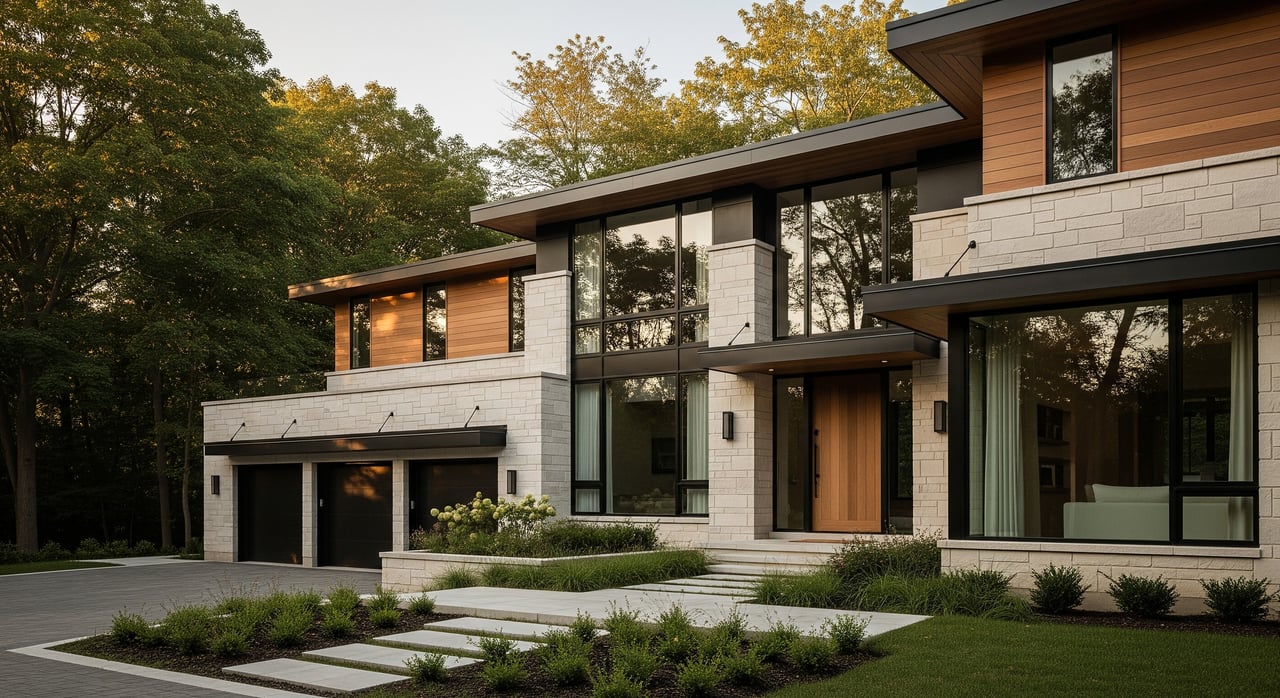
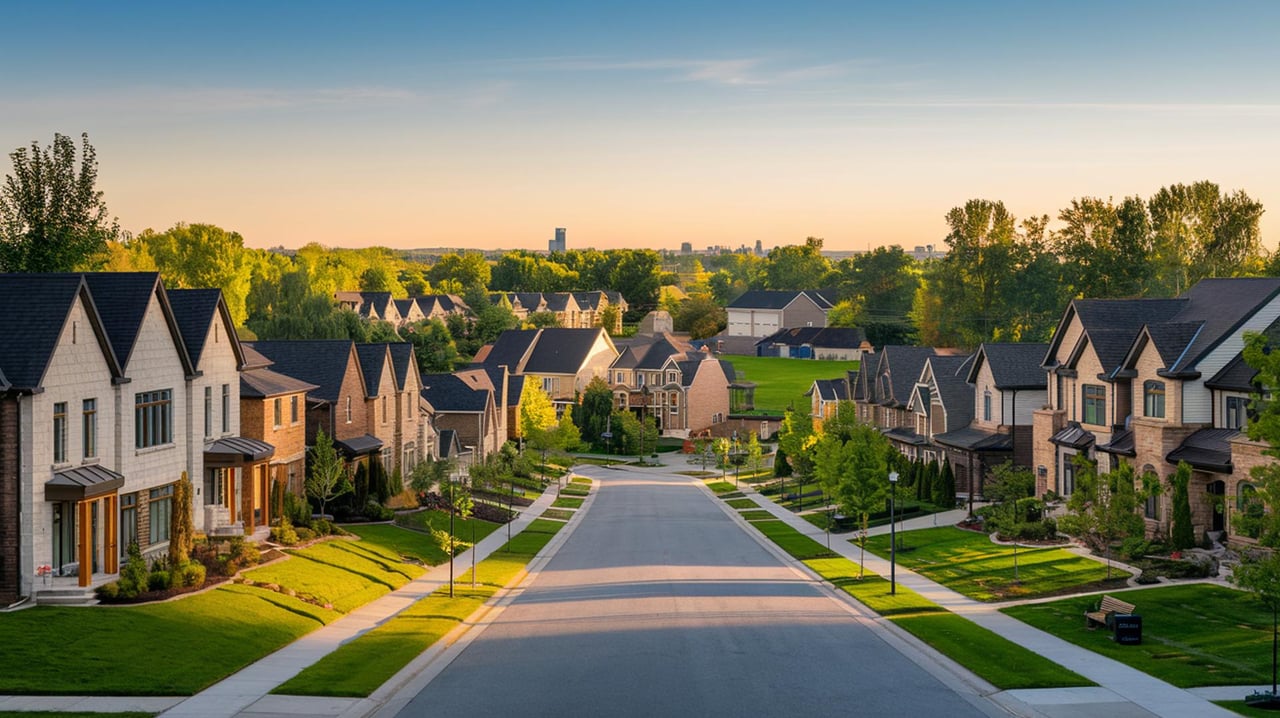
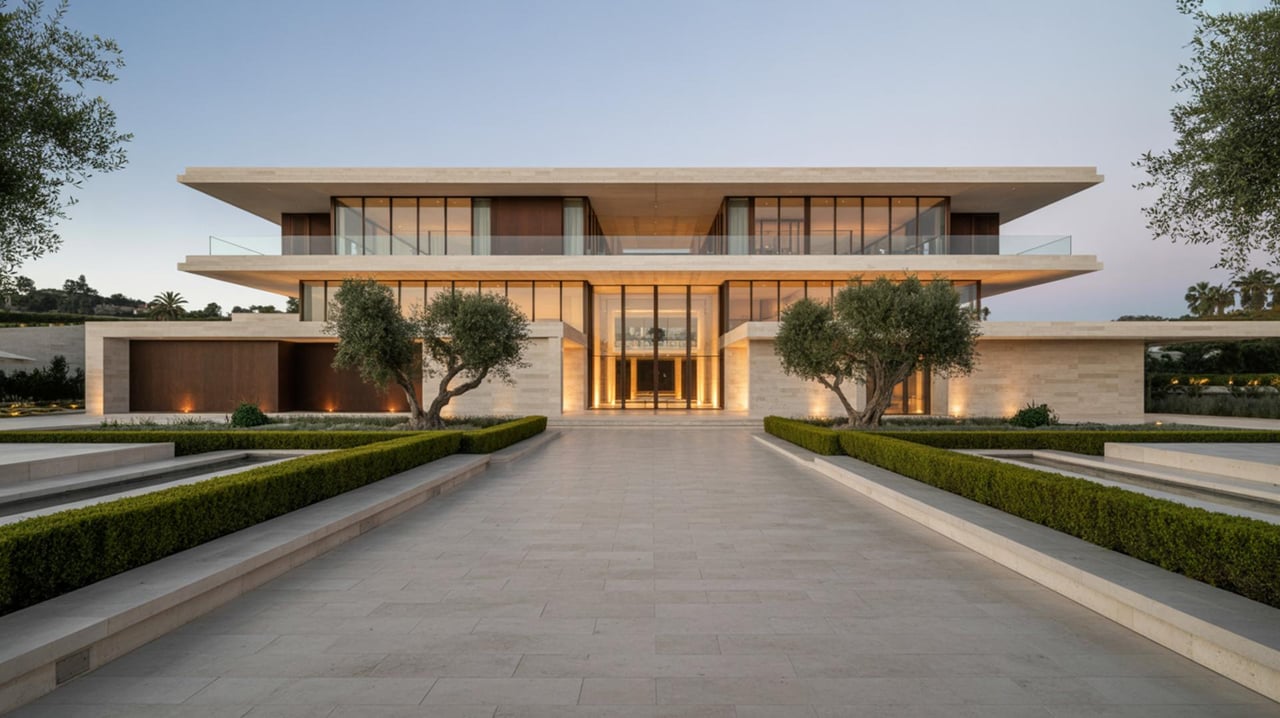
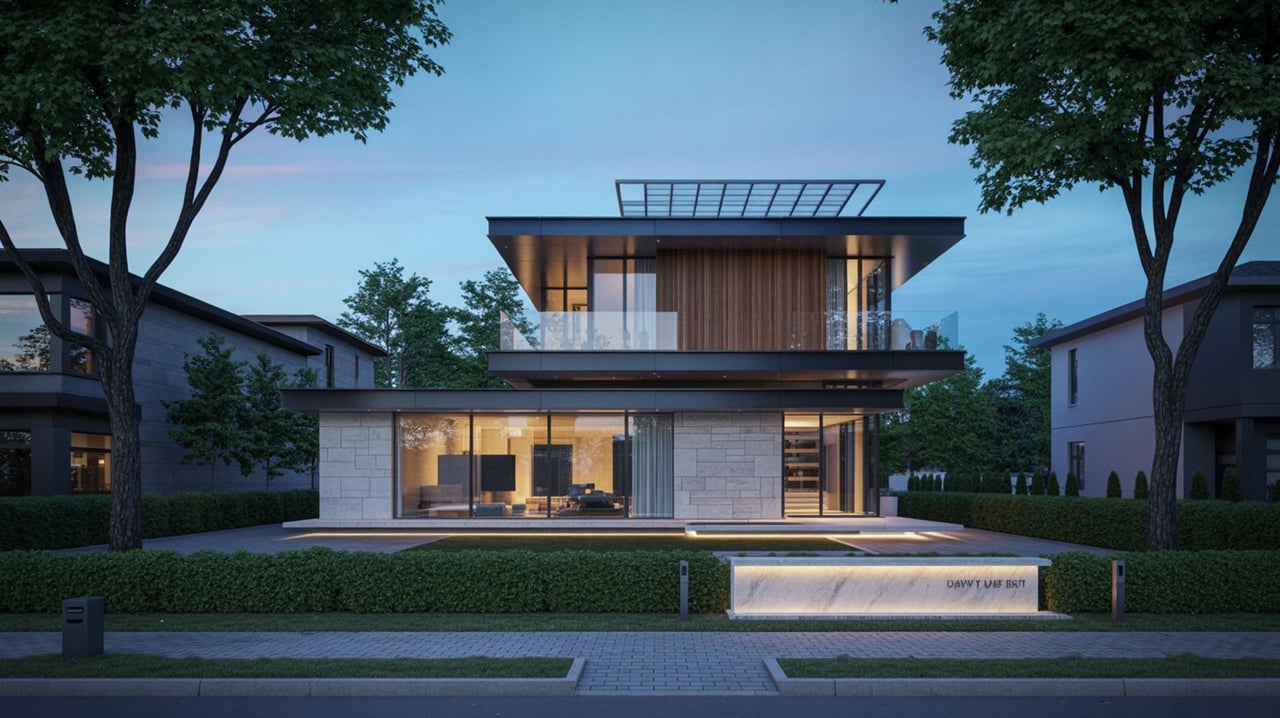
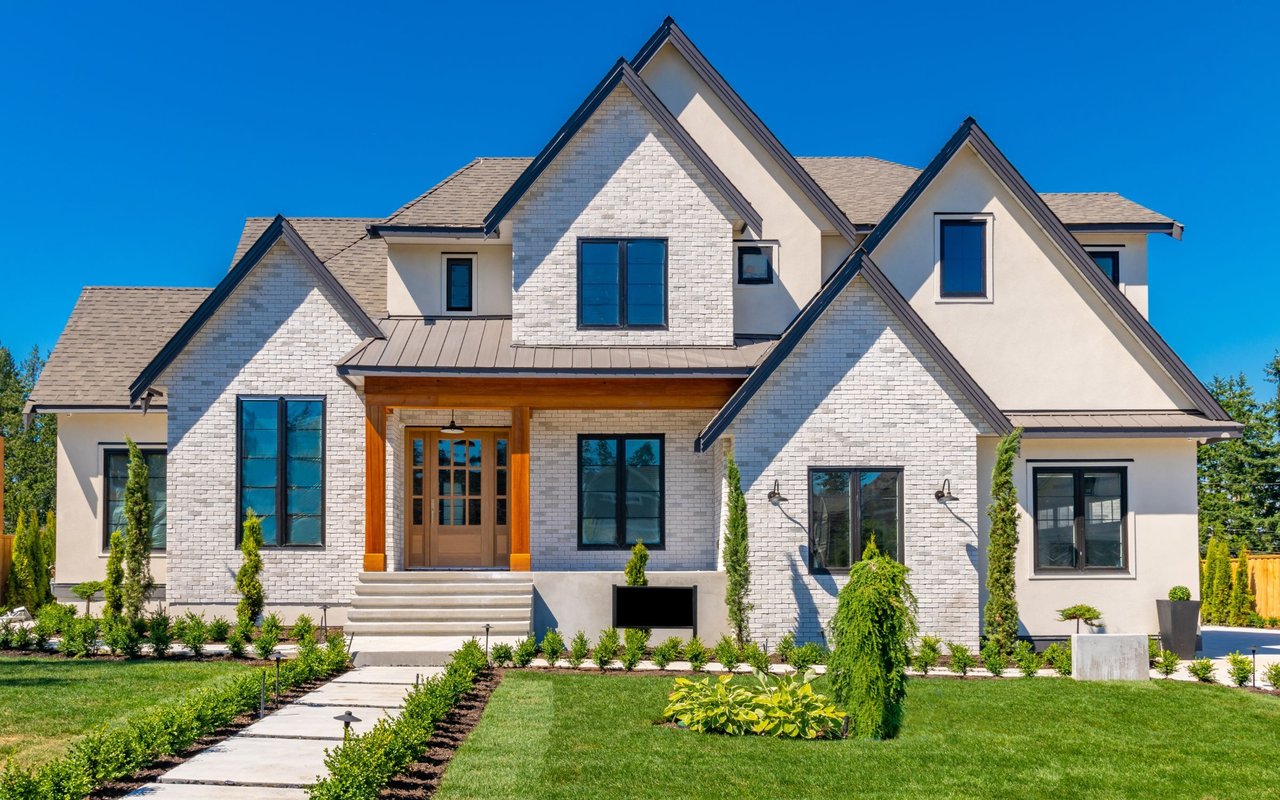
The Bayview side of Harding is a different neighbourhood wearing the same name. Detached houses sit on residential streets away from the arterial roads, closer to Harding Park and the German Mills Creek pathway system that the town's own neighbourhood history traces back to the Rose-growing estates of the early 1900s. There are currently 25 detached houses and 18 condos listed for sale across all of Harding, and no active townhome listings at all. That absence of a middle category is itself informative. Harding doesn't have a gradual price ladder from condo to house. It has two rungs and a gap.
The dollar gap between those rungs shows up everywhere. The most affordable condo listed in Harding right now sits around $349,000. The most expensive condo tops out near $988,000. Detached houses pull the average up from there, which is how a neighbourhood with a $606,000 condo average ends up with a $1,618,000 blended average once the houses get folded in.
What Three Quarters Of TRREB Data Actually Show
The Toronto Regional Real Estate Board publishes quarterly community reports broken out by property type, and Harding's numbers over the past year make the two-market story concrete.
| Quarter | Detached median price | Condo apartment median price | Detached days on market | Condo days on market | Detached sales-to-new-listings | Condo sales-to-new-listings |
|---|---|---|---|---|---|---|
| Q1 2024 | $1,383,000 | $682,000 | 21 | 27 | 44% | 50% |
| Q4 2024 | $1,490,000 | $628,000 | 25 | 34 | 56% | 83% |
| Q1 2025 | $1,547,000 | $623,000 | 27 | 32 | 13% | 27% |
Two threads run through this table. The detached median climbed steadily across the year, from $1,383,000 to $1,547,000, while days on market stretched from 21 to 27. Condo apartment pricing moved the opposite direction, sliding from a $682,000 median to $623,000, which lines up with the broader softening in condo townhouse and apartment pricing that's been reported across Richmond Hill through 2026.
The second thread is harder to explain away with a supply-and-demand story alone. The sales-to-new-listings ratio, which measures how much of a market's fresh inventory actually sells, swung from a roughly balanced 44 to 50 percent in Q1 2024 up to a tight 56 to 83 percent by Q4 2024, then collapsed to 13 to 27 percent by Q1 2025. That's not a gentle cooling. That's a market that looked competitive one quarter and looked like a clear buyer's advantage the next.
Some of that swing is real market movement, consistent with the wider pullback across Richmond Hill's resale market through the end of 2024 and into 2026. But TRREB's own reporting notes that some statistics aren't published when a segment records two transactions or fewer, which is a reminder of how thin the Harding dataset actually is. A neighbourhood moving four or five detached sales in a quarter will see its ratios swing hard on the strength of one or two closings going a different way than the last. The lesson isn't that the data is wrong. It's that a single quarterly ratio for a neighbourhood this size tells you less than it appears to, and it should never substitute for looking at what specifically sold on your street in the last 90 days.
The Richmonde Is The Clearest Single Data Point
If you want to see the condo side of Harding without the noise of neighbourhood-wide averaging, look at one building. The Richmonde at 18 Harding Boulevard was completed in 2010 with 364 units across 14 storeys, and its sales history over the past 12 months gives a tighter read than the blended Harding numbers can: units have sold roughly 3 percent below list price on average, with a typical marketing period of about 41 days. That's a meaningfully longer timeline and a meaningfully softer pricing outcome than the detached side of the neighbourhood is currently posting.
The building sits close enough to walk to Haze Restaurant + Lounge and Mr. Congee Chinese Cuisine within about seven minutes, with Richmond Centre, Observatory Place Plaza, and Hillcrest Mall a few minutes further. That proximity matters for a specific kind of buyer. Across Harding overall, ownership sits at roughly 86 percent versus 14 percent renting, but the math on a condo purchase here still runs differently than the detached side: a median monthly mortgage across Harding sits around $6,200, against a median monthly rental closer to $2,200. Anyone weighing a Harding condo as a rental hold needs to run that gap against their own numbers rather than the neighbourhood's blended mortgage figure, which is pulled upward by the detached side.
How Harding Actually Compares To Its Neighbours
Harding's closest neighbours frame the split even more clearly. Mill Pond carries the highest average home price among the group at $1,706,000, reflecting its older bungalow stock increasingly being replaced by custom new builds along its namesake pond. Crosby sits at the other end, with the most affordable average among Harding's neighbours at $1,069,000, a reflection of its more industrial and commercial presence along the rail corridor.
Harding's blended $1,618,000 average lands close to Mill Pond's number, which would suggest to a casual reader that Harding and Mill Pond are priced similarly. They aren't, not really. Mill Pond's number describes a fairly consistent stock of aging bungalows and their custom-build replacements. Harding's number describes a detached segment pushing $1.5 million sitting alongside a condo segment in the $600,000s, averaged into a figure that resembles Mill Pond by coincidence rather than by comparable housing stock.
That's also why buyers cross-shopping Richmond Hill's more affordable pockets often talk about Crosby and Harding in the same breath as a roughly $900,000 entry point into the city, even though Harding's official average sits nearly double that. Both neighbourhoods sit east of Yonge with more commercial and rail presence than the manicured subdivisions further north, and the $900,000 figure buyers are actually referencing usually points to Harding's more modest freehold stock rather than its condo towers or its higher-end detached streets. The number people repeat and the number the neighbourhood publishes are describing two different slices of the same map.
What This Means If You're Comparing Numbers Online
Before you treat any published figure for Harding as a planning number, find out which side of the neighbourhood it's describing. A $1,618,000 average is not a starting point for a condo search, and a $606,000 condo average won't get you a detached house on the Bayview side. Ask for sold comps segmented by property type, not neighbourhood-wide medians, and ask how many transactions sit behind any ratio you're being shown. A sales-to-new-listings ratio built on four sales moves very differently than one built on forty, and Harding's quarterly reports have shown exactly how far that ratio can swing on a small sample.
If you're weighing a condo purchase on the Yonge corridor against a detached house further toward Bayview, treat them as two separate searches with two separate sets of comparables, even though both will show up under the same neighbourhood name.
Is Harding's average price a fair way to budget for a home search here? Not on its own. The average blends a condo segment in the $600,000s with a detached segment above $1.5 million, so the neighbourhood-wide number won't match what you find touring either side.
Why did Harding's market ratios swing so much between quarters? Part of it reflects real cooling in the condo segment and firming in detached pricing through 2024 and into 2026, and part of it reflects how few transactions Harding records each quarter, which makes any single ratio sensitive to just one or two sales landing differently than the last.
If you're trying to figure out which side of Harding actually fits your budget and your search, or you want sold comps pulled for the specific streets you're considering rather than the neighbourhood-wide blend, Kevin Lin Realty can walk you through the current data street by street.